


Meet us at iFx Cyprus
Running a proprietary trading firm means juggling multiple high-stakes priorities simultaneously. Managers must recruit talented traders, set performance benchmarks, implement risk controls, oversee daily operations, and scale without losing their competitive edge. Prop firm management requires a delicate balance between giving traders freedom to perform while maintaining systems that protect the firm's capital. Success depends on proven strategies that improve trader performance, control risk, and enable sustainable growth.
The right infrastructure makes all the difference when executing these management strategies effectively. Firms need integrated systems for trader evaluation, automated risk management, and scalable platforms that grow with the business. Rather than piecing together disconnected software or building everything from scratch, successful prop firms rely on comprehensive solutions that monitor trader activity, enforce risk parameters, and enable data-driven decisions. Tech Trade offers prop firm technology designed specifically to support these critical management goals.
Most people think prop firm management is mainly about managing trading risk and preventing large drawdowns. However, risk is only one part of a much larger operational system.

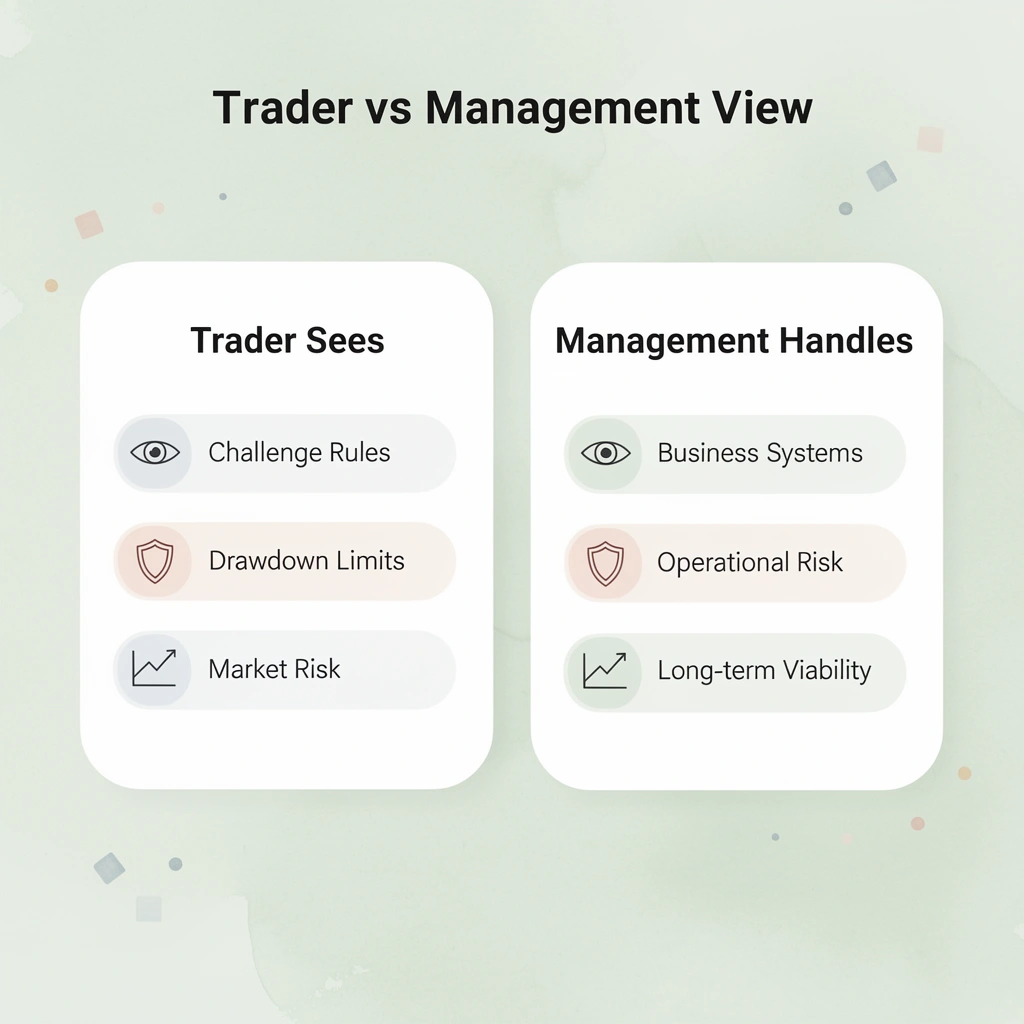
Traders see only challenge rules and drawdown limits. Educational content addresses market risk, leverage risk, and operational risk because traders experience these directly. The business systems beneath the surface—those that determine whether a firm can pay out money or grow profitably—remain hidden. It's the difference between managing a trading desk and operating a business that monitors thousands of accounts simultaneously while maintaining sufficient liquidity for withdrawals.
🎯 Key Point: Prop firm management extends far beyond risk controls—it requires coordinating complex operational systems that traders never see, but that determine the firm's long-term viability.
"The business systems running underneath decide whether a firm can pay out money or grow profitably—these stay hidden from traders who only see challenge rules and drawdown limits."
⚠️ Warning: Understanding only the trading side of prop firms gives you an incomplete picture of how these businesses actually operate and what makes them successful or causes them to fail.

The risk exposure system is one layer. You also need a trader evaluation system that processes challenge completions, identifies behavioral patterns, and flags anomalies across your pipeline. Then there's the payout and liquidity system, which determines whether you can fulfill withdrawal requests when traders hit profit targets. According to ACY Securities, 90% of prop traders fail within the first 90 days, but firms collapse not from trading losses: they fail from mismanaged liquidity, poor payout timing, or a lack of the performance and behavior analytics needed to spot variance sensitivity before a crisis hits.
Think of it like insurance underwriting. You're managing total exposure across thousands of policies, predicting claim frequency, maintaining reserves for payouts, and pricing risk correctly. A prop firm that monitors only individual traders' risk resembles an insurer that checks whether each claim exceeds a limit without tracking total liability or cash reserves. The constraint isn't whether one trader loses too much—it's whether your system handles the distribution of outcomes across all funded traders.
Focusing only on the trader creates problems you can't see. You set strict rules for how much money you can lose, use position sizing limits, and watch leverage exposure. But this doesn't verify whether your system for choosing traders is actually turning challenges into funded accounts at a rate you can sustain, or whether your payment schedule matches the money you actually have.
Companies fail not because one trader breaks the rules, but because they fund too many accounts without sufficient capital to cover simultaneous withdrawals, or because their data analysis misses patterns where multiple traders concentrate risk in the same area.
Instead of assembling separate software components, prop firm technology combines all four systems into a single integrated framework. Our approach unifies trader evaluation, risk monitoring, payout processing, and behavioral analytics, in which liquidity constraints inform evaluation criteria and performance data shape risk parameters in real time.
But even with integrated systems in place, most firms hit a ceiling they cannot break through for a deeper reason.
Firms build comprehensive risk frameworks: drawdown limits, daily loss caps, position sizing rules. Yet they fail. The problem isn't that the rules don't work. Individual trader discipline cannot prevent system-level failures: payout obligations clustering, evaluation filtering gaps, or liquidity timing creating cascading pressure across the operation can trigger insolvency regardless of how well traders follow risk protocols.

🎯 Key Point: Even the most sophisticated risk management systems can't prevent firm-wide collapse when structural vulnerabilities create domino effects that overwhelm individual trader compliance.
"The majority of prop firm failures stem from operational risk rather than trading losses, with liquidity mismanagement and payout clustering being primary catalysts." — Risk Management Institute, 2024

⚠️ Warning: Focusing solely on trader-level risk controls while ignoring systemic operational risks creates a false sense of security that can lead to catastrophic firm-wide failures.
Risk management feels like protection because it's measurable. You set a 5% drawdown limit, enforce a 0.5% position-size cap, and monitor dashboards that show 95% compliance. The system appears stable. What you're not seeing is that these rules constrain individual account risk while your actual exposure builds silently across trader groups, payout schedules, and market correlation windows.
When multiple funded traders hit winning streaks simultaneously—which happens more often than probability models suggest because they're trading the same setups in the same market conditions—your payout liability compounds rather than scaling linearly. A Deloitte analysis from 2023 found that operational risk in financial services firms often stems from systemic dependencies that static controls can't detect, rather than from rule violations. Your risk system watches each tree while the forest catches fire.
The first failure driver is payout liability clustering. Forty percent of account blowups occur when traders risk 3-4% to pass evaluations quickly, but the opposite problem is worse: when top performers become profitable simultaneously, you face withdrawal demands your liquidity cannot handle. The second is poor evaluation filtering. Optimizing for trader acquisition—marketing zero-time limits, 100% profit splits, and aggressive discounts—floods your system with unsuitable trader behavior.
Passing traders aren't necessarily those whose risk profiles create sustainable business economics. The third is misaligned incentives. Traders are rewarded for passing fast and trading aggressively once funded, but you need patient, consistent performers whose profitability doesn't create correlated payout events. The fourth is liquidity timing stress. Your backend must copy trades of consistent performers at scale, but when winning streaks synchronize across your trader population, you simultaneously execute payouts, maintain margin requirements, and manage your own hedging exposure.
Companies improve metrics that drive growth: evaluation completion rates, funded account creation, and customer acquisition cost. These metrics improve by relaxing qualification rules, offering better payment splits, and simplifying the funding process. However, each change that attracts more traders increases exposure to the four failure problems mentioned earlier.
The company appears profitable on paper—evaluation fees exceed operational costs, funded traders generate revenue from trade copying, and payout structures remain within projections—until a significant market swing, simultaneous payouts, or correlated losses render the system unable to meet its obligations.
Risk systems built on historical data assume trader behavior remains constant, yet it doesn't. After losing streaks, traders panic and use full margin on the next setup. High-impact news events blow accounts within five-minute windows. Market conditions shift, and your entire funded population trades the same directional bias.
Your static rules—designed at different volatility levels, with a smaller trader population, under different correlation patterns—cannot adapt fast enough. The 89% failure rate in the first two weeks signals that your evaluation structure filters for the wrong behavioral patterns while risk controls measure the wrong variables.
Platforms like prop firm technology combine risk monitoring, trader evaluation, payout processing, and behavioral analytics into a single system. Rather than applying uniform rules, our system adjusts risk settings based on current trader behavior, available trading capital, and performance correlations across your funded traders.
When evaluation filtering flags high-risk traders early, payout obligations don't suddenly accumulate. When risk monitoring detects behavioral changes before accounts fail, you can manage overall system stability rather than react to individual problems.
But even integrated systems and adaptive risk controls don't address the deeper issue: most firms are structurally designed around a model that cannot scale.
Running a prop firm requires systems that prevent three types of failures: payout clustering that drains liquidity, evaluation designs that attract the wrong traders, and risk exposure that compounds faster than it can be detected. The strategies below address these failure points, offering substitution logic for when manual controls suffice and when automation becomes essential.

🎯 Key Point: The most successful prop firms focus on preventing failure cascades rather than just managing individual trader performance. Risk management at the firm level requires different tools from trader-level controls.
"Prop firms that survive market volatility implement automated risk controls at 3 distinct levels: trader evaluation, position sizing, and firm-wide exposure monitoring." — Risk Management Institute, 2024

⚠️ Warning: Many prop firms fail because they treat payout management as a secondary concern, but liquidity crunches from clustered successful trades can shut down operations faster than bad risk management from individual traders.
The fastest way traders lose evaluation accounts is by chasing profit targets with oversized positions. They risk 5% per trade, hoping to hit the target within days, only to exceed the drawdown limit before the week ends. The correct approach is the opposite: risk 0.5–1% per trade, and aim for steady compounding rather than big wins that disappear as quickly as they appear.
Traders who pass challenges often achieve 1–2% profit per week. Consistency outperforms intensity, and careful position sizing reduces account drawdowns and extends trader longevity. This approach identifies traders with the mindset to manage real capital.
Low-risk evaluation parameters select for traders who understand that survival comes before performance: the trader profile is worth funding.
Most traders plan only for winning trades, entering evaluations with profit targets, but no plan for managing losing streaks. Firms must design evaluations that require traders to plan for loss scenarios up front: reducing lot sizes after consecutive losses, pausing trading during high-volatility windows, or entering trades only when confidence signals align.
Setting a personal loss tolerance level within the firm's drawdown limit creates a buffer that prevents traders from hitting maximum drawdown. According to ACY Securities, disciplined risk frameworks are effective when loss thresholds are clearly defined and monitored.
Early-stage firms can use spreadsheets to track traders' loss patterns and review accounts weekly. However, as trader volume grows past 50 active accounts, manual tracking becomes impractical. Automated risk monitoring systems become necessary because variance scaling means one missed red flag can trigger a liquidity event.
Traders should not risk the same percentage in week one of an evaluation as in week four, with a profit buffer. In the early stages, keep risk low to observe market behavior and confirm the strategy's suitability. Once a profit cushion is established, slightly increase risk on high-probability setups to reach the target faster while maintaining safety.
This approach to risk management works better because traders can complete more challenges without getting stuck with rigid rules that don't fit their situation. Companies that allow traders to adjust risk based on account size outperform those using uniform risk limits.
Instead of fixed risk limits, companies introduce tiered risk allowances that unlock as traders demonstrate consistency. Manual oversight handles 10 evaluations per month, but processing 200 requires automated systems that adjust risk permissions based on real-time equity curves.
Position sizing determines how much money you put into each trade based on your account size and risk tolerance. Traders typically risk between 0.5–2% of their total account per trade, keeping losses small enough to absorb several losing trades without depleting the account.
Think about Bryan. He has a $100,000 account with a prop firm and a 10% maximum drawdown limit. He risks 0.5% per trade ($500) and adjusts his position size so that hitting his stop loss costs exactly $500. This consistency allows him to survive multiple losing trades without exceeding the drawdown limit.
Traders who master position sizing stay funded longer. Firms that enforce it via automated lot-size calculators reduce breach rates by filtering out traders who cannot follow basic risk rules.
Stop-loss orders are important risk management tools that automatically close a trade at a specified loss level, limiting potential losses. By enforcing discipline, they prevent emotional decision-making and keep losses manageable. Firms requiring stop-loss placement on every trade see fewer catastrophic account blowouts because the system enforces discipline when trader judgment falters under pressure.
Manual stop-loss tracking works for a handful of traders, but managing 100+ active accounts requires automated trade monitoring to flag missing stop-losses or those placed beyond acceptable risk thresholds. This shifts trade execution oversight from reactive review to proactive enforcement.
The trend-pullback strategy waits for the market to pull back into a key level before rejoining the main trend. This keeps you aligned with momentum, filters out false moves, and protects your account from unnecessary losses.
This setup works equally well for day traders monitoring intraday swings and swing traders holding positions for several days. Because it naturally limits over-trading, it's ideal for prop firm challenges, where hitting daily loss limits is the primary reason traders fail.
Find the higher-timeframe trend using the daily or 4-hour chart and assess the 20/50 EMA slope and price structure. Mark the pullback zone at a prior swing point, fair value gap, or 50–61.8% Fibonacci retracement. Drop to a lower timeframe (M15–M5) and wait for a confirmation signal: a strong engulfing candle, a break of structure, or a momentum push in the trend's direction. Manage risk by risking 0.25–0.75% per trade, sizing positions based on stop-loss distance, and targeting 1.5R–3R profits.
Prop firms favor this approach because risk control reduces the chance of breaking daily or total drawdown limits. Trading with the trend and waiting for pullbacks avoids excessive or impulsive entries. Built-in patience naturally prevents over-trading since the market won't provide valid pullbacks every hour.
Avoid stacked correlated trades. If EURUSD, GBPUSD, and AUDUSD all show similar pullbacks, pick the cleanest one; multiple correlated trades can sink you if the USD suddenly spikes. Set a floating drawdown guardrail: if your daily drawdown reaches 3–4% on a 5% limit, close positions and protect the account.
The break-and-retest strategy is one of the cleanest, most rule-based ways to trade prop firm challenges. It works best during high-volume sessions like London and New York, where price breaks out of overnight ranges and tests those levels before continuing in the same direction.
This strategy offers clear structure and logical entry points. Instead of guessing, you wait for confirmation: a level breaks, retests, and then you enter. This reduces impulsive trades and provides the structured framework critical when daily loss limits are in play.
Find the range or key level on the M30–M15 timeframe using the Asia session range or the prior session's high and low. Wait for a clear breakout with volume at session open, avoiding fake breakouts by waiting for a clean close beyond the level. Watch for the retest as price pulls back to the broken level, then enter on a strong rejection candle in the breakout direction. Place your stop just beyond the retest wick and target liquidity zones, such as the next pool or the Average Daily Range projection.
Keep risk between 0.5–1% per trade, limit yourself to 2–3 trades per day, and size positions based on stop distance rather than confidence.
This works for prop traders because your trading sessions with lots of buyers and sellers, creating cleaner price moves and less slippage. Clear invalidation makes risk easy to define. Waiting for both a break and a retest helps you avoid entering every breakout.
Avoid news traps: if the breakout happens right before major news like NFP or CPI, it's often fake. Unless your firm permits news trading and you've accounted for spread widening, skip that setup. Protect your daily drawdown by avoiding another breakout trade in the same session if your first trade fails and you're near your loss limit.
The session reversal fade strategy is a precise tool for rare but powerful opportunities. It catches the moment when an overextended session runs itself out and reverses, rather than chasing trends. For prop firm traders, it can deliver 2–4R or more per trade, but only with discipline.
This low-frequency play appears a few times weekly and works best during London and New York sessions, when price frequently overshoots its daily range before snapping back.
Look for one-sided sessions that run 1.25–1.5 times the average daily range. Check higher timeframes (H4 or Daily) to find strong supply or demand zones. Wait for a liquidity sweep in which price moves slightly beyond the higher-timeframe level before reversing. Confirm on the M5 by watching for a structure shift: a lower high after the sweep for shorts, or a higher low for longs. Enter on confirmation, place stops just beyond the sweep, and target 2–4R.
Keep risk at 0.25–0.5% per trade, limit yourself to one attempt daily, and trail aggressively once the move begins.
This works for prop firms because high reward-to-risk pushes you toward profit targets without breaching loss limits. Clear criteria eliminate guessing: you wait for the price to extend beyond ADR and sweep liquidity. Patience-focused execution prevents over-trading, a common challenge killer.
Stop after one loss. Chasing another reversal quickly breaches daily loss limits. Skip setups where the price hasn't run far enough beyond ADR. Respect firm timing rules by standing aside during restricted news windows, even if the setup looks perfect.
Trading around news events solves the liquidity buffering problem, but only if your firm explicitly allows it. When traders break blackout rules or enter positions seconds before a major release, spread widening can cause slippage of 2 to 4 times beyond the set stop-loss levels, wiping out accounts instantly, even when the trade idea was correct.
This strategy works best during major releases such as CPI, NFP, FOMC, or interest rate decisions, when volatility drives strong one-directional moves. It can deliver results if you stay within prop firm policies and account for slippage as part of the cost structure.
Build your bias beforehand using the broader macro context (recent CPI trend, rate-hike cycle) and higher-timeframe structure. When the number drops, spreads can explode. Wait 1 to 3 minutes for spreads to normalize and the first pullback to form, then drop to a lower timeframe (M1 to M5) and look for a clean continuation pattern: a flag, pullback candle, or mini break-and-retest.
Adjust stops and sizing to account for spread spikes. Use a wider stop than normal and cut risk to 0.25–0.5% per trade to stay within prop limits and avoid the exposure clustering that occurs when traders size aggressively into volatile events.
Know the blackout rules. Many firms enforce flat positions minutes before and after major events. Violating this voids your account, so confirm your firm's exact timing policy. If your firm prohibits trading during the event, shift to post-news trades. Wait 10 to 30 minutes after the release for spreads to settle; the continuation setup often still plays out in compliance.
Don't overtrade news. One clean continuation setup is enough. Chasing every spike quickly breaches your daily drawdown, the primary reason traders fail challenges.
The swing trend-following strategy addresses poor trader distribution. When companies attract only scalpers and intraday traders, they accumulate a homogeneous group that trades identical sessions, applies the same leverage, and loses accounts during the same volatility spikes. Swing traders improve distribution by holding positions over multiple days, spreading risk exposure over time rather than concentrating it in a single session.
This approach suits traders who prefer patience over frequency, with fewer trades per week. It's ideal if you find intraday trading stressful or struggle with over-trading during challenges. Not all firms allow overnight or weekend positions, so choose one with flexible holding policies.
Find the bigger trend by looking at Daily (D1) and 4-hour (H4) charts using tools like the 20/50 EMA or classic support and resistance levels. Wait for the price to pull back to key levels or EMA zones, then enter on the H4 or M30 after a strong rejection or break-of-structure signal.
Manage your trades over multiple days by taking profits at 1R to protect your capital, then moving your stop-loss under the swing structure to stay in the trend. This approach prevents all-or-nothing outcomes that create clustering of payouts.
Keep risk conservative at 0.25 to 0.75% per trade, as gaps can exceed stop-loss levels. Limit simultaneous exposure to correlated pairs (e.g., EUR/USD and GBP/USD). Size down positions to account for overnight volatility and keep your firm's total exposure manageable when individual trades go wrong.
Pick a firm with flexible holding policies and no strict time-in-trade limits. Watch for weekend gaps—reduce your position size or hedge if holding through Friday close, as gaps can easily exceed your stop losses. When managing multiple swing positions with trailing stops across different pairs, manual tracking becomes unreliable. Automated alerts and position monitoring are essential to prevent clustering that exposes your firm to breaches of its aggregate risk limits.
Scalable capacity management means your funding decisions follow system health, not sales targets. You expand when liquidity reserves exceed payout obligations by a defined margin, when risk monitoring infrastructure can track additional positions without lag, and when evaluation systems maintain filtering accuracy as trader volume increases. The constraint isn't how many traders you want to fund—it's how many your system can support without degrading performance or increasing exposure beyond your capital buffer.

🎯 Key Point: Your funding capacity should be determined by operational limits, not growth ambitions. Scale only when your infrastructure can handle the additional load without compromising risk management or trader experience.
"Successful prop firms maintain a 3:1 ratio of liquidity reserves to active trader payouts, ensuring they can weather market volatility without operational stress." — Proprietary Trading Industry Report, 2024

⚠️ Warning: Many prop firms fail because they prioritize rapid scaling over system stability. Always ensure your risk monitoring, payout processing, and trader evaluation systems can handle increased volume before expanding your trader base.
Think of capacity as something that changes based on what's happening in your business. When you have less money saved up than 150% of what you need to pay out over the last 30 days, stop taking on new funding until you build up your reserves. When it takes more than two seconds to check risks during busy trading times, stop adding new traders until your systems can handle more. When the number of people who pass your evaluation goes up more than 15% compared to normal, make your behavior checks stricter before you fund more accounts. Each part of your system sets limits for the other parts. Growth happens when you stay within those limits.
Your risk engine controls exposure across every funded account, but most firms monitor individual trader compliance rather than system-level vulnerability. A trader staying within a 5% drawdown limit reveals nothing about whether fifty traders hitting 4.8% drawdowns simultaneously creates compounded liquidity stress.
The risk engine must calculate aggregate exposure across correlated positions, detect clustering in drawdown timing, and flag when multiple traders exhibit similar behavioral patterns that amplify systemic risk. According to Fortex's 2025 analysis, firms implementing dynamic risk monitoring see a 20% boost in challenge success rates by identifying variance sensitivity before it compounds into operational instability.
The engine requires three concurrent monitoring layers. First, tracking each trader's position to enforce stop losses, position size limits, and drawdown thresholds in real time. Second, group-level analysis that organizes traders by strategy type, market focus, and behavioral profile to detect synchronized movement.
Third, firm-wide exposure calculation that combines all open positions, pending payouts, and liquidity reserves. When group correlation exceeds 0.6 or firm-wide exposure surpasses 40% of available liquidity, the system automatically tightens individual trader limits or pauses new account funding until exposure normalizes.
Your evaluation system controls the quality of risk entering your operation. Most firms treat evaluation as a pass-or-fail filter based on profit targets and drawdown limits, overlooking the behavioral signals that predict post-funding stability.
The evaluation system must feed behavioral data directly into the risk engine so that funded traders enter with risk profiles already mapped. A trader who hit 10% profit across 22 trading days, with no single day exceeding a 1.5% gain, carries a different systemic risk than one who reached the same target in 9 days, with three 4% winning days. Both passed. Only one shows variance sensitivity that compounds under stress.
Integration means that evaluation metrics become risk-classification inputs. Maximum consecutive winning days, drawdown-to-profit ratio, average daily volatility, and consistency score flow into the risk engine as trader-specific parameters.
When a newly funded trader opens their first position, the risk engine adjusts position limits based on their historical variance profile. High-variance traders start with tighter caps, while consistent performers receive standard limits.
When payouts occur, it affects how much capital you have available, which determines how much risk you can take across funded accounts. When multiple payout requests arrive during the same market cycle, you need reserves to handle the rush without halting new funding or tightening risk limits on existing accounts. The payout system must inform the risk engine and the capacity management layer of outstanding obligations so that funding decisions reflect upcoming liquidity needs.
A firm with $500,000 in reserves looks stable until $320,000 in payout requests are scheduled for the next two weeks. Suddenly, capacity shrinks.
Most firms treat payouts as an accounting function separate from risk management, creating blind spots. The risk engine must include pending payout obligations as capital already committed, not as available reserves. Capacity management must account for both current liquidity and scheduled outflows over the next 30 days before funding new traders.
The payout system feeds forward-looking liquidity data that shapes every operational decision. Without that integration, you're managing risk with incomplete information about your actual available capital.
Scalable firms aren't built by adding traders. They're built by controlling system interactions under variance, where each layer constrains and informs the others, creating operational boundaries that expand only when every system confirms it has the capacity to support growth.
Most prop firms fail for one reason: they try to control risk at the trader level instead of at the system level. When payouts, evaluations, and liquidity operate separately, exposure builds invisibly until clustered wins or withdrawals break cash flow.
The fix is to restructure management around a single control loop:
This replaces static rules with adaptive system-level controls, in which funding and risk limits respond to actual portfolio-wide conditions rather than fixed thresholds. You can implement this in under 5 minutes:
Audit your current setup here: https://www.tradetechsolutions.io/. Use the "prop firm technology" consultation to map your payout exposure gaps, evaluation-filtering weaknesses, and risk-system blind spots. Our platform identifies where your structure breaks and what to adjust first for scalable control. Start now for a breakdown of your priority fixes.

.png)